
In this post we will take a look at the big picture of how monitoring systems work nowadays by looking at tools Grafana, Prometheus, Loki and other.
Prometheus <-> Your Application metrics
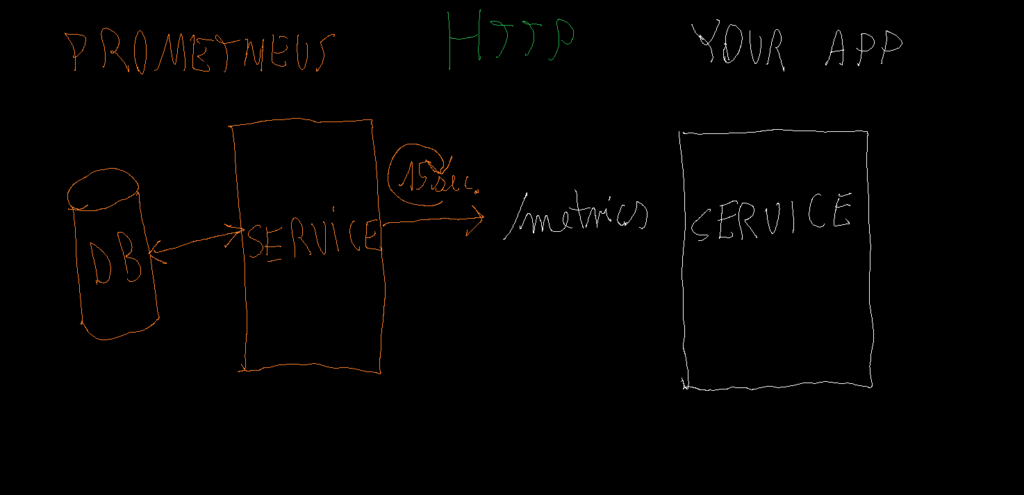
As depicted in the picture the idea is that your application exposes /metrics endpoint where Prometheus reads from time to time (usually every 15 seconds) provided metrics which must be in valid format. Here is a sample content:
# HELP http_requests_total The total number of HTTP requests.
# TYPE http_requests_total counter
http_requests_total{method="POST",status="200"} 1027
http_requests_total{method="GET",status="200"} 3180
http_requests_total{method="GET",status="404"} 162

# HELP http_request_duration_seconds The duration of HTTP requests in seconds.
# TYPE http_request_duration_seconds histogram
http_request_duration_seconds_bucket{le="0.005"} 0
http_request_duration_seconds_bucket{le="0.01"} 1
http_request_duration_seconds_bucket{le="0.025"} 43
http_request_duration_seconds_bucket{le="0.05"} 200
http_request_duration_seconds_bucket{le="0.075"} 300
http_request_duration_seconds_bucket{le="0.1"} 443
http_request_duration_seconds_bucket{le="0.25"} 980
http_request_duration_seconds_bucket{le="0.5"} 1200
http_request_duration_seconds_bucket{le="1"} 1500
http_request_duration_seconds_bucket{le="+Inf"} 1520
http_request_duration_seconds_sum 600.5
http_request_duration_seconds_count 1520

# HELP system_cpu_usage The CPU usage of the system.
# TYPE system_cpu_usage gauge
system_cpu_usage{core="0"} 0.5
system_cpu_usage{core="1"} 0.6
Grafana <-> Your application logs
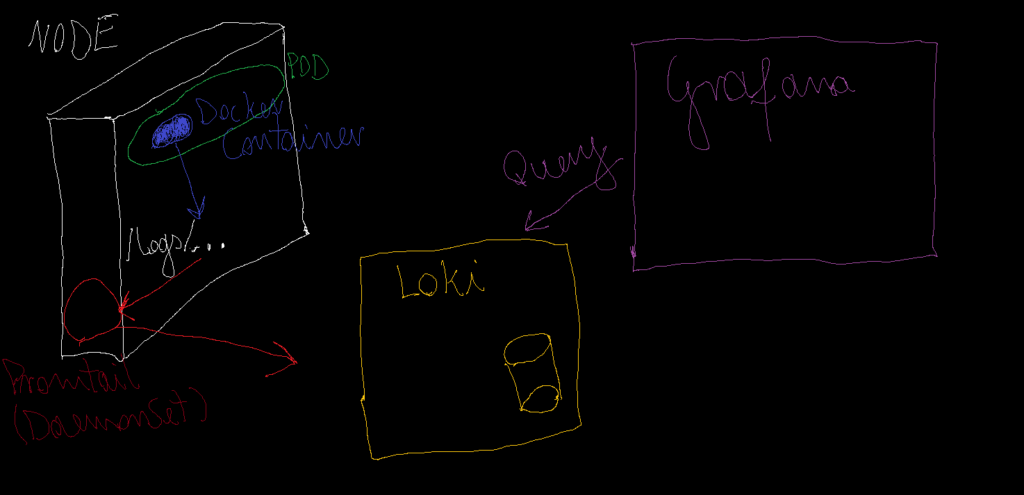
Here we have a bit more complex scenario:
1. Usually we have a container (runningw within a pod which runs within a node) which logs are stored in /logs catalog
2. We need to install a tool which can read logs from the node and send it outside – in this case it is Promtail (installed as DaemonSet)
3. Logs are sent to external service (in this case Loki) which stores logs and does indexing so that other services can fastly query it
4. Then we have a nice querying tool like Grafana which can ease querying and present results in a nice way